Viewing Logs and Monitoring Services
Logs and monitoring help you understand what is happening on your server. If a service is not working, logs are usually the first place to check.
What you can monitor
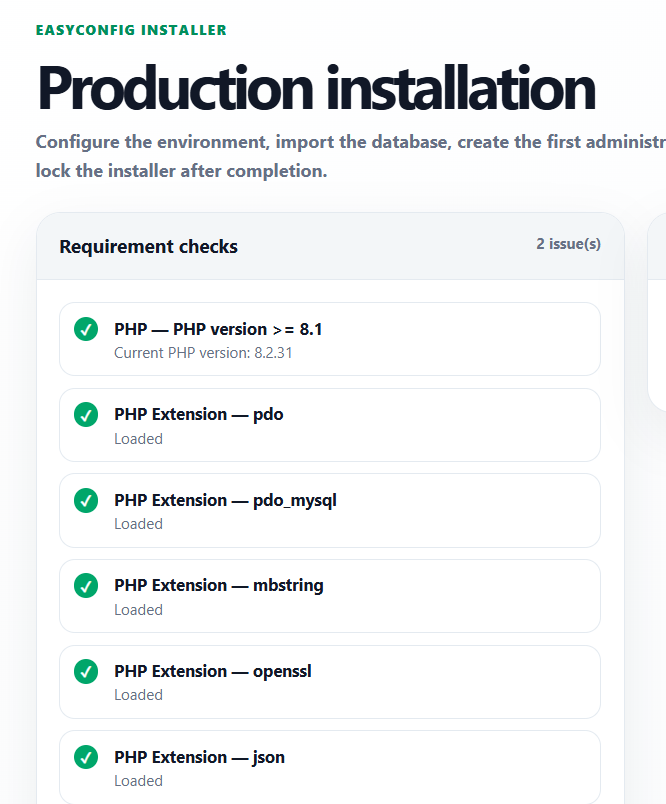
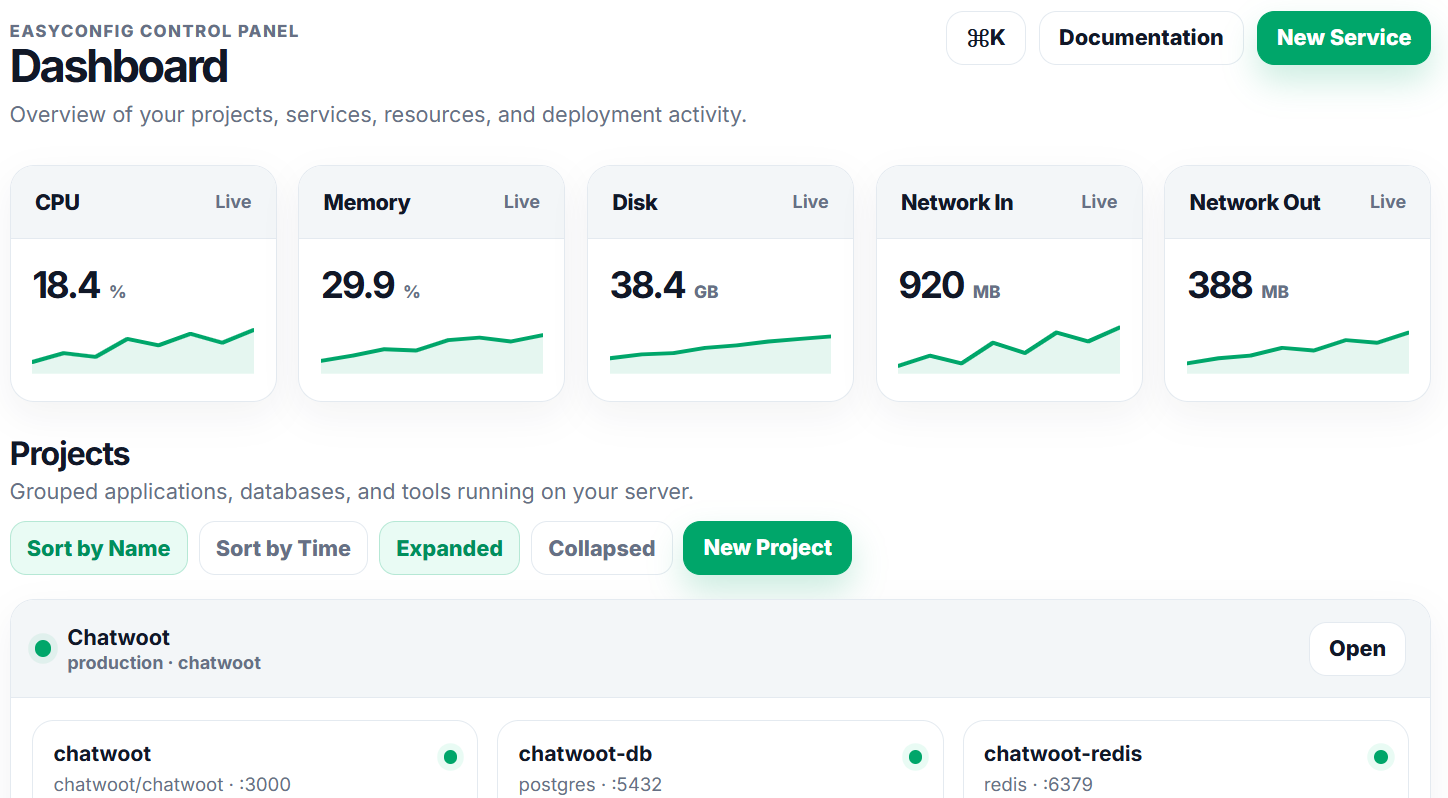
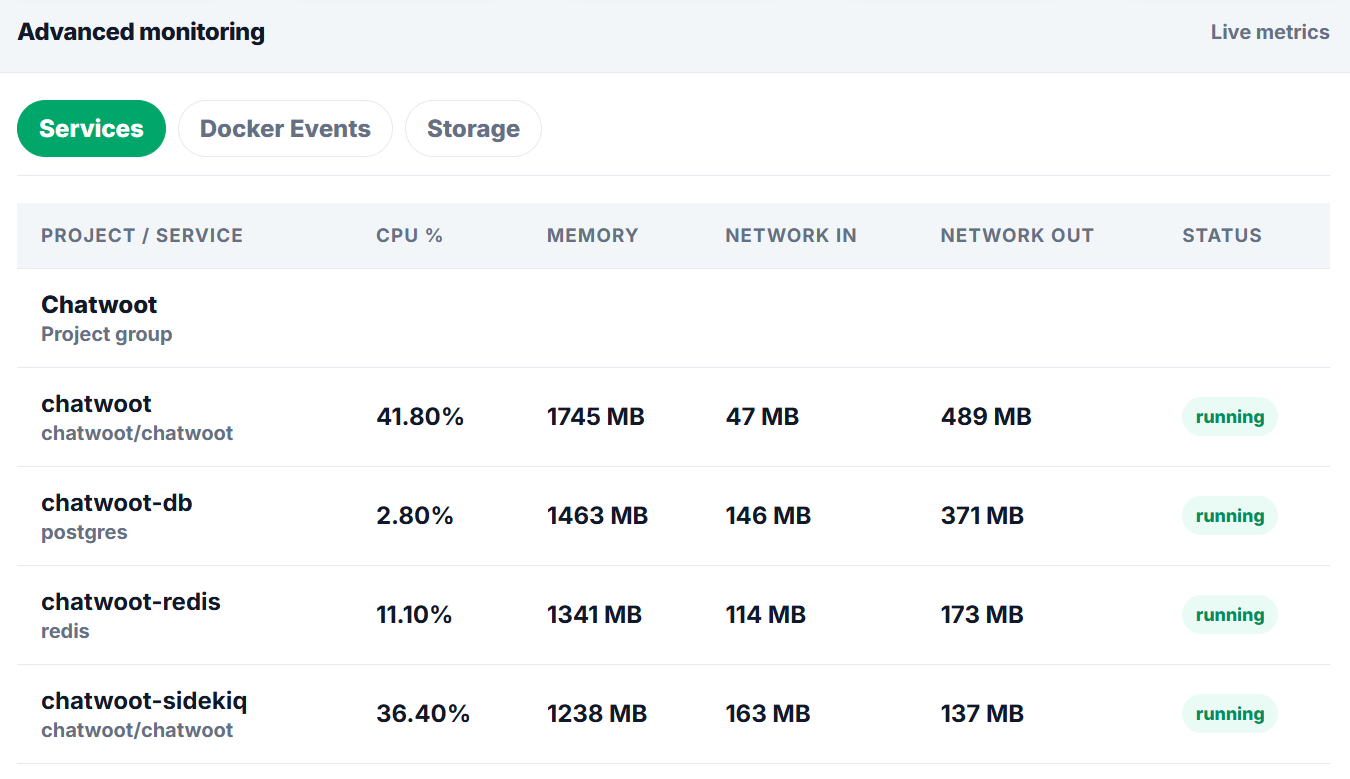
- Service status such as running, stopped, failed, or building.
- CPU usage.
- Memory usage.
- Network input and output.
- Disk usage.
- Recent deployment actions.
- Docker event records.
How to view service logs
- Open your project.
- Select the service you want to inspect.
- Open the logs area.
- Review recent log lines for errors or warnings.
Common log messages
- Connection refused: The app may be trying to connect to the wrong database host or port.
- Permission denied: A volume or file permission may be incorrect.
- Port already in use: Another service may already be using the same port.
- Invalid environment variable: A required value may be missing or incorrectly typed.
Commands
The panel handles most actions visually, but these commands help beginners understand what a server operator usually checks while working with Docker-based deployments.
docker --version
docker compose version
docker ps
docker logs --tail=100 container_name
df -h
free -m
Summary
| Area | What to check | Expected result |
|---|---|---|
| Server | CPU, RAM, disk, firewall, Docker | The server has enough resources and Docker is available. |
| Application | Image, tag, port, variables, storage | The service can start and keep data after restart. |
| Network | DNS, proxy route, SSL, browser response | The app is reachable from the correct domain. |
| Security | Roles, secrets, audit logs, backups | The setup is safe enough for continued operation. |
Screenshots
Upload screenshots to the paths below when you want the documentation to show real easyconfig interface examples.
Next
- Apply the guide in a test project first.
- Check logs after every deployment or configuration change.
- Document custom values for future handoff.
- Review related documentation when domains, SSL, databases, or billing are involved.